August 5, 2026
When was the last time your business found an IT problem before someone reported it?
If the answer is "we usually find out when something breaks," your business may be reacting too late.
24/7 IT monitoring gives your team continuous visibility into the health of your systems, helping you identify warning signs, investigate issues earlier, and take action before they develop into costly outages.
In this guide, we explain what IT monitoring does, why downtime can become expensive for businesses of all sizes, and how a practical monitoring approach can help you reduce disruptions and keep your technology running reliably.
TABLE OF CONTENTS
- What Is IT Monitoring?
- Why Do Systems Go Down in the First Place?
- What Downtime Actually Costs?
- How 24/7 IT Monitoring Actually Prevents Downtime
- Comparing IT Monitoring Tools
- Building a Basic 24/7 IT Monitoring Strategy
- IT Monitoring Checklist
- Improve Your IT Reliability With Better Monitoring
- Frequently Asked Questions
What Is IT Monitoring?
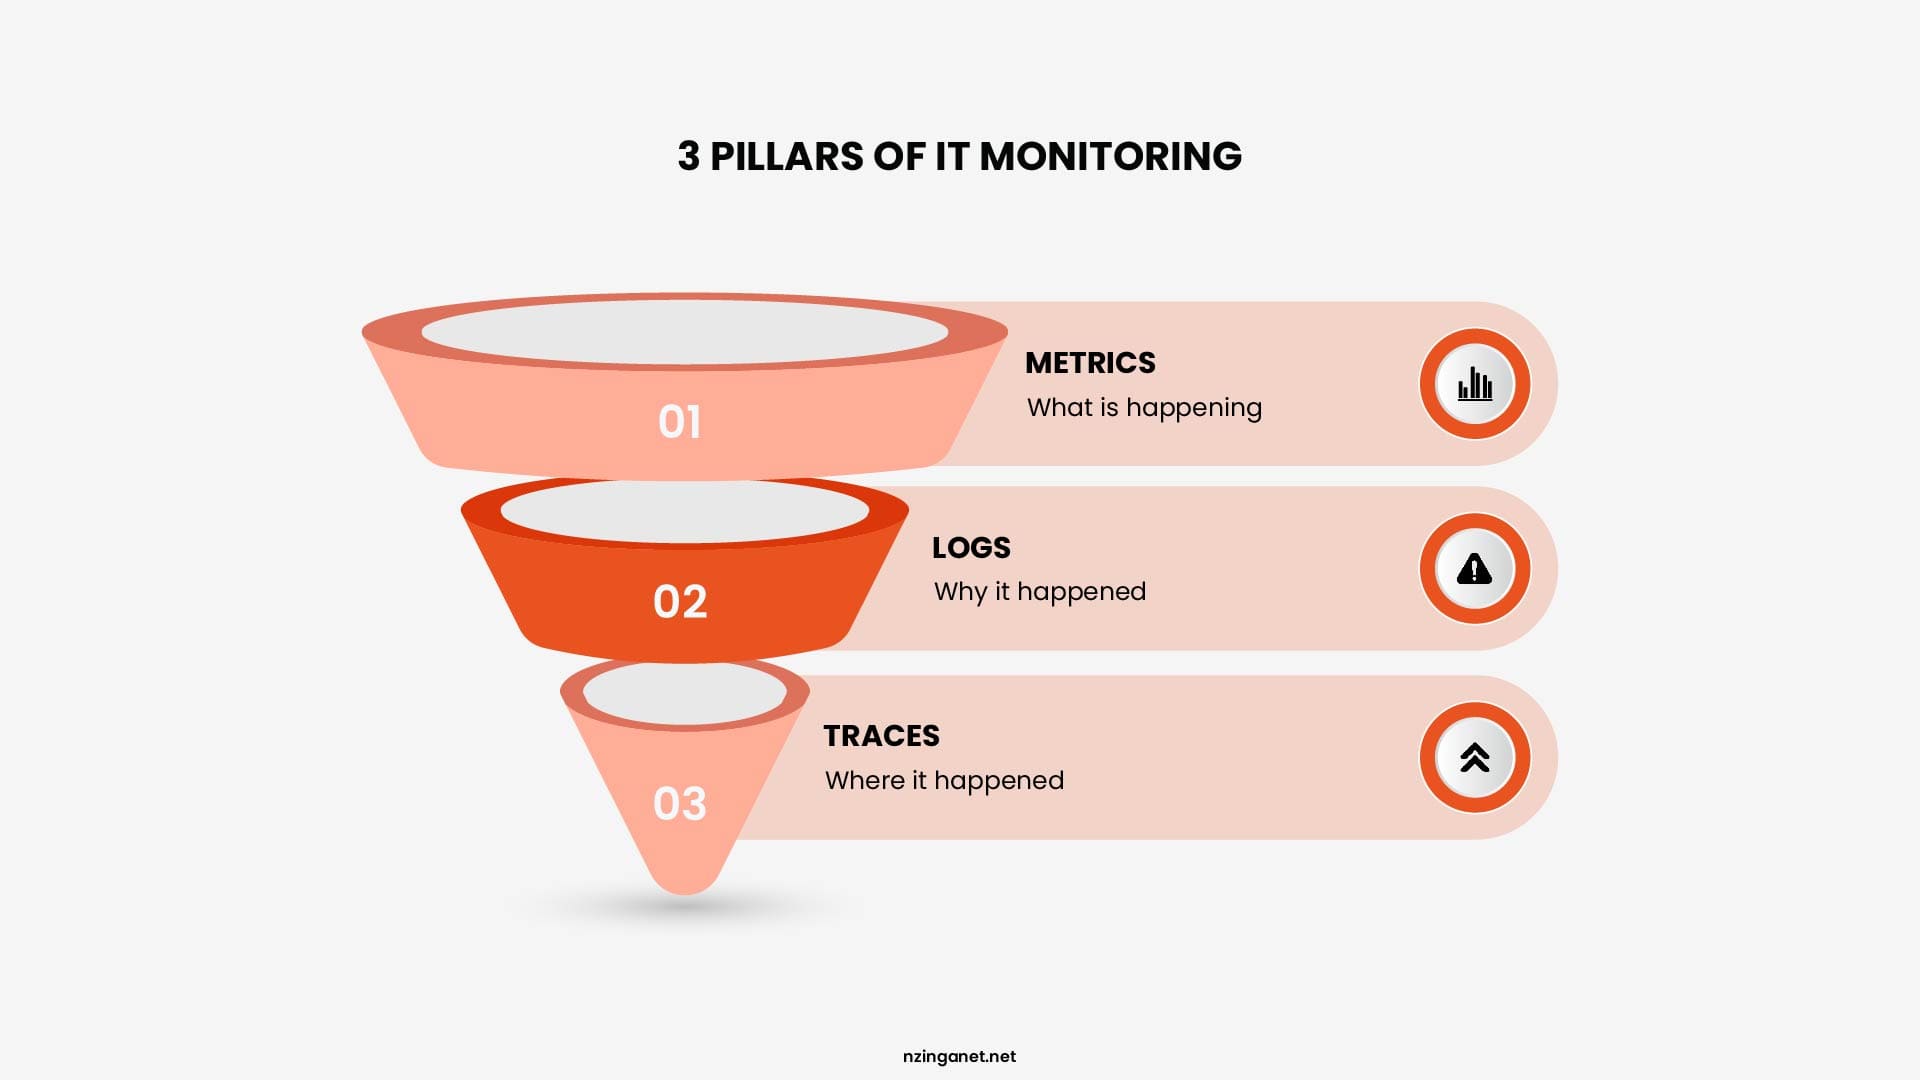
IT monitoring is the continuous tracking of your servers, networks, applications, and cloud services to confirm they're running the way they should. A monitoring system checks things like server response time, CPU and memory load, disk space, network traffic, application uptime, and security events, then alerts your team the moment something drifts outside a safe range.
The "24/7" part matters because problems don't wait for business hours. A server can run out of disk space at 2am. A network switch can fail over a weekend. A cloud region can have an outage while your office is asleep. Without round the clock coverage, these issues sit unnoticed until someone shows up the next morning, and by then the small glitch has often turned into a full outage.
The Core Types of IT Monitoring
IT monitoring covers every layer of an organization's technology environment, from physical infrastructure to applications, networks, security, and the end-user experience. Each type of monitoring focuses on a different aspect of system health and performance:
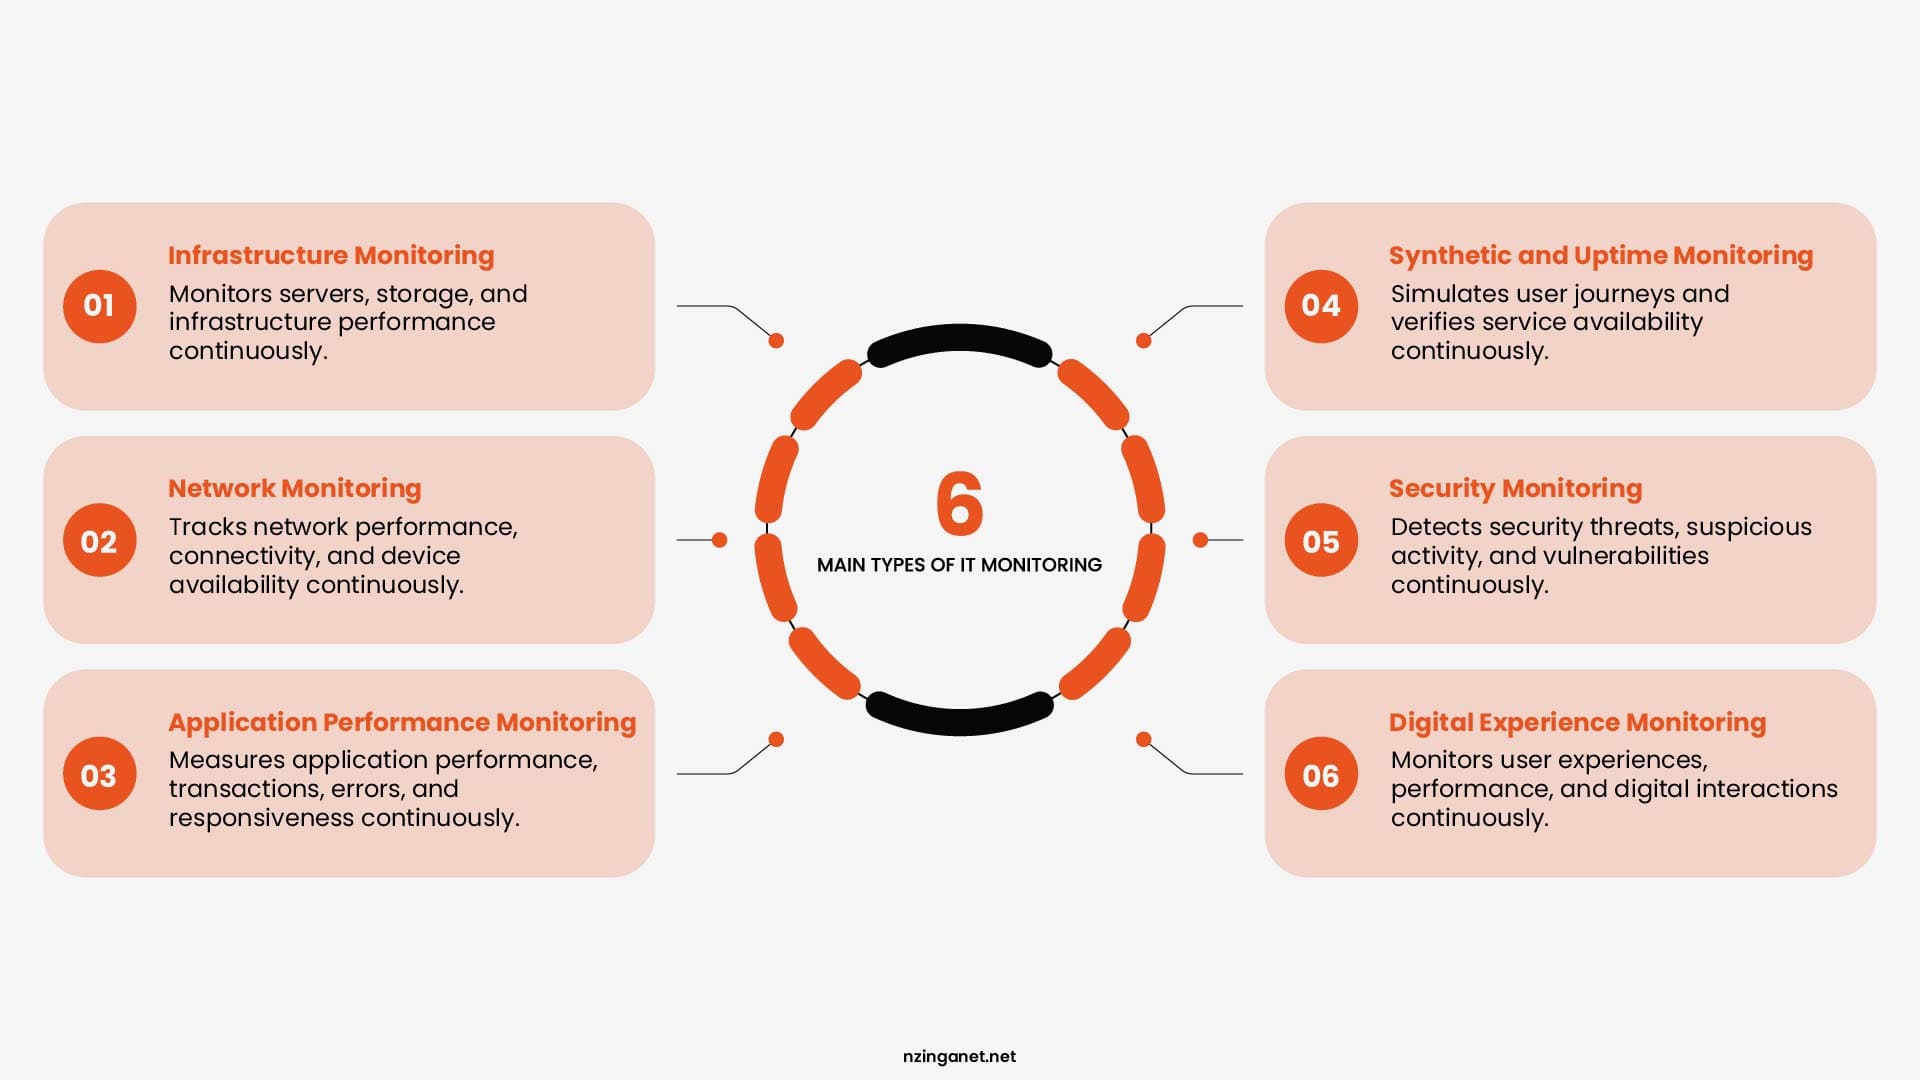
- Infrastructure Monitoring: Infrastructure monitoring tracks the health and performance of physical and virtual servers, storage systems, databases, and other core infrastructure components. It helps identify issues such as high CPU or memory usage, disk failures, and hardware problems before they affect business operations.
- Network Monitoring: Network monitoring focuses on the performance and availability of network devices and connections, including routers, switches, firewalls, and wireless networks. It measures metrics such as bandwidth usage, latency, packet loss, and network availability to ensure reliable connectivity.
- Application Performance Monitoring (APM): Application Performance Monitoring (APM) measures how software applications perform from both technical and user perspectives. It tracks response times, transaction performance, database queries, error rates, and code-level issues to help identify bottlenecks and improve application reliability.
- Synthetic and Uptime Monitoring: Synthetic monitoring uses automated tests to simulate real user interactions with websites, applications, or APIs from external locations. Combined with uptime monitoring, it verifies that services are available and functioning correctly from a customer's perspective, not just within the organization's internal network.
- Security Monitoring: Security monitoring continuously analyzes logs, network traffic, system events, and user activity to detect suspicious behavior, potential threats, and security incidents. It helps organizations identify attacks early, respond quickly, and maintain compliance with security policies.
- Digital Experience Monitoring (DEM): Digital Experience Monitoring (DEM) measures how users actually experience websites and applications. Using real user monitoring (RUM) and synthetic testing, DEM tracks metrics such as page load times, application responsiveness, and user interactions to help organizations optimize the overall customer experience.
Why Do Systems Go Down in the First Place?
Systems usually go down because of a combination of technical failures, human mistakes, and unexpected events. Understanding these causes helps explain why IT monitoring is not just about sending alerts after something breaks. It helps businesses identify warning signs early and address issues before they lead to downtime.
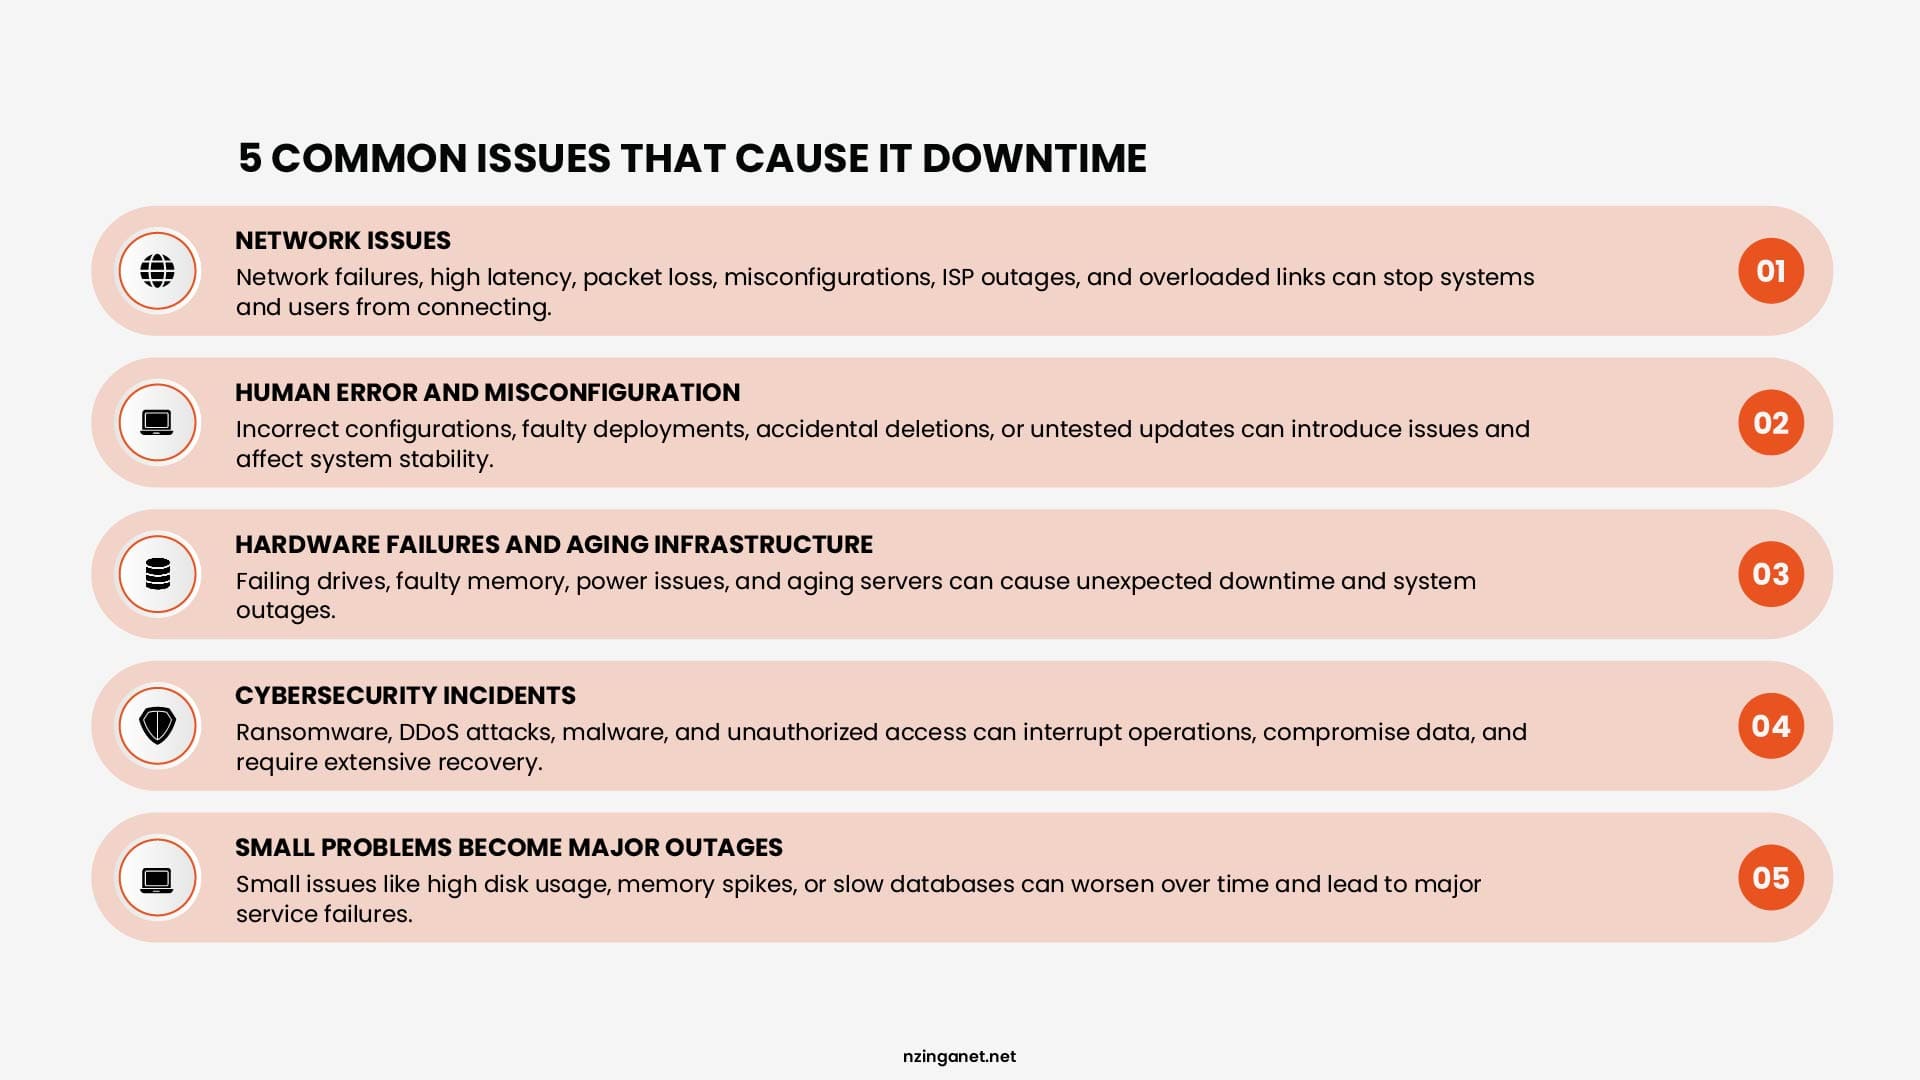
Here are the five most common causes of system downtime and their impact:
Network Issues
Network failures remain one of the leading causes of IT downtime. Problems such as high latency, packet loss, misconfigured routers or switches, ISP outages, and overloaded network links can prevent users and systems from communicating, bringing critical services to a halt.
Human Error and Misconfiguration
Many outages result from routine changes that don't go as planned. Incorrect server configurations, faulty software deployments, accidental deletions, or untested updates can introduce issues that affect system stability. Even experienced IT teams can make mistakes, making change monitoring and validation essential.
Hardware Failures and Aging Infrastructure
Physical components eventually wear out. Failing hard drives, faulty memory, power supply failures, and aging servers can all cause unexpected downtime. While modern cloud infrastructure environments reduce some hardware risks, organizations with on-premises infrastructure remain particularly vulnerable to equipment failures.
Cybersecurity Incidents
Cyberattacks are an increasingly common source of downtime. Ransomware, distributed denial-of-service (DDoS) attacks, malware infections, cybersecurity mistakes and unauthorized access attempts can interrupt business operations, compromise sensitive data, and require lengthy recovery efforts. These incidents are often among the most costly because they involve investigation, remediation, and regulatory or customer notifications.
Small Problems Become Major Outages
Most outages don't happen without warning. They typically begin as small, manageable issues that gradually worsen over time. Disk space fills up, memory consumption steadily increases, databases respond more slowly, network latency rises, or packet loss becomes more frequent. Left unchecked, these early warning signs eventually lead to service degradation or complete system failure.
What Downtime Actually Costs?
The exact cost of downtime depends on an organization's size, industry, and the systems affected. However, every major study reaches the same conclusion: downtime is becoming significantly more expensive each year.
One of the clearest demonstrations of downtime's true cost occurred during the July 2024 CrowdStrike incident. A faulty software update caused approximately 8.5 million Windows devices worldwide to crash in less than 80 minutes, disrupting airlines, hospitals, banks, retailers, and government services across multiple countries.
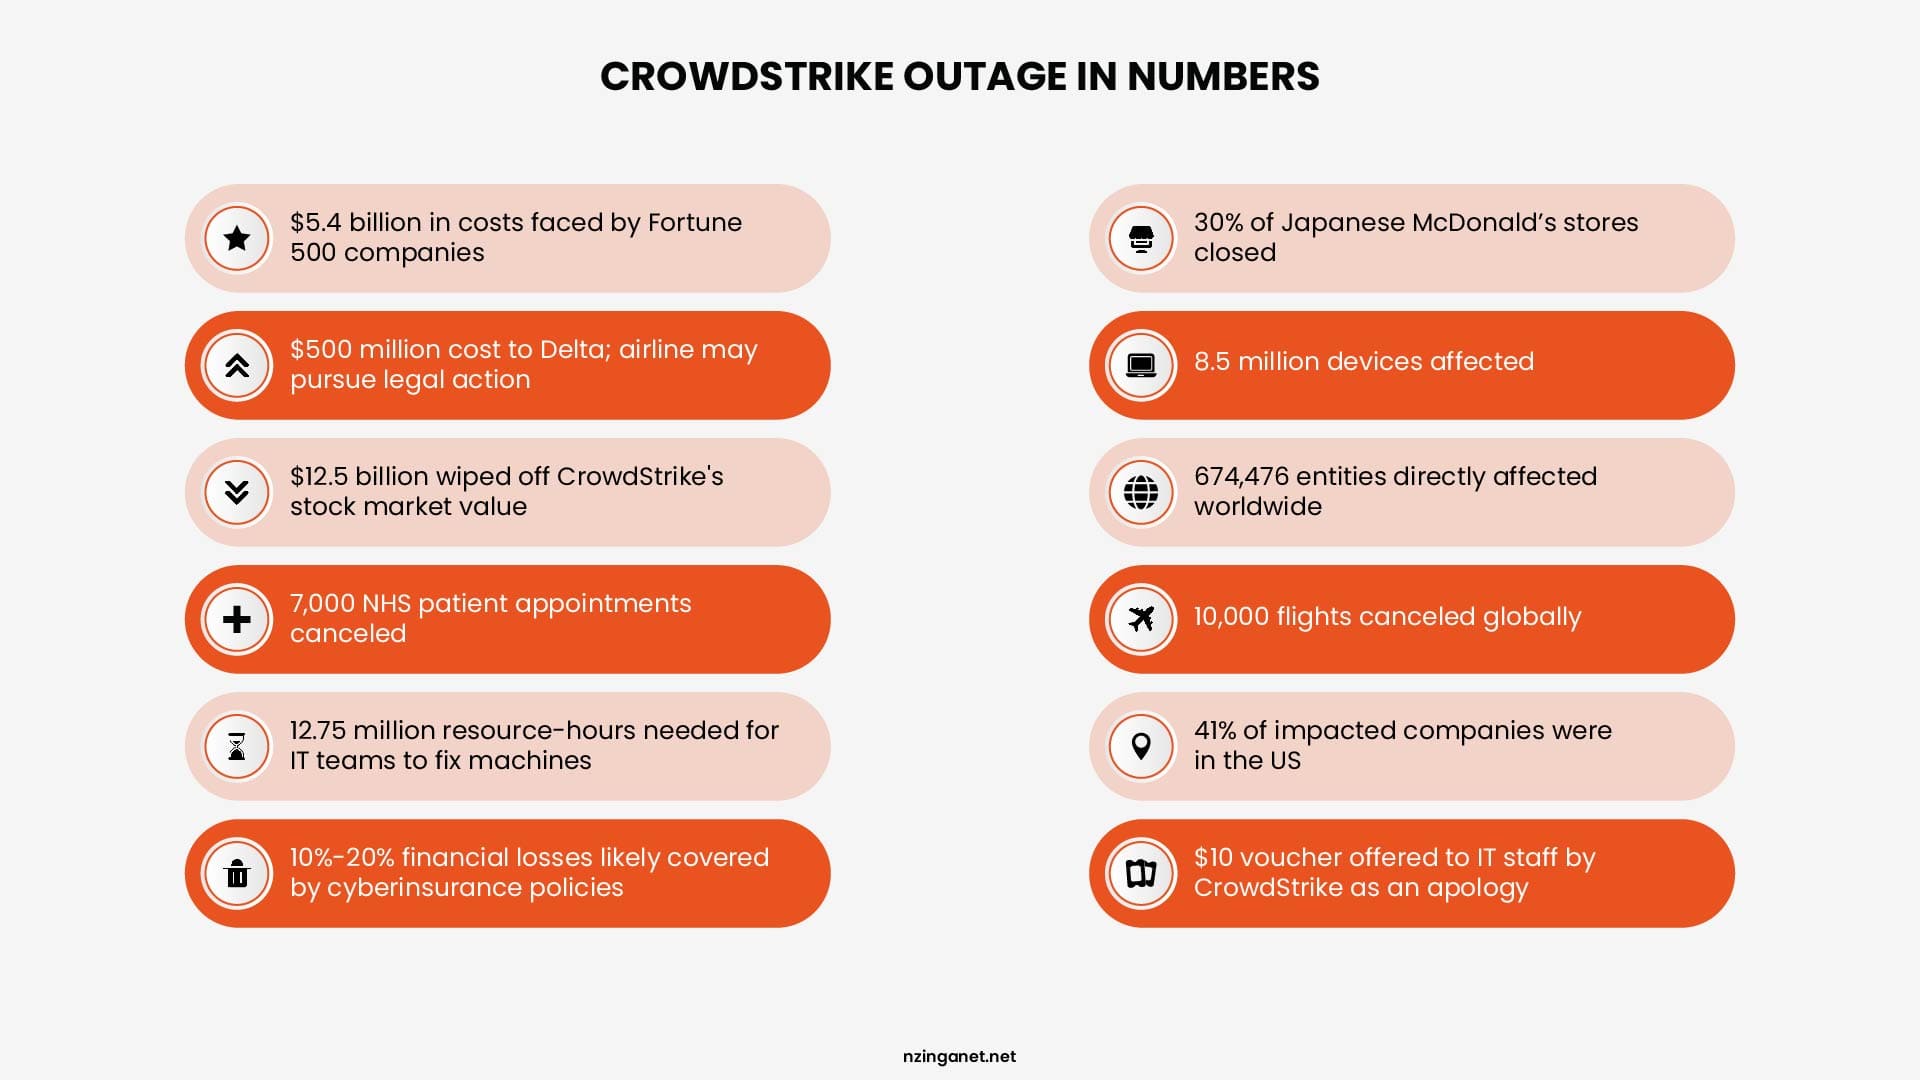
According to insurance analytics firm Parametrix, the outage generated an estimated $5.4 billion in direct losses for Fortune 500 companies alone. Healthcare organizations accounted for nearly $1.9 billion of those losses, while airlines collectively lost more than $860 million through cancelled flights, operational disruptions, and customer compensation.
The incident highlighted an important reality: even organizations with mature IT operations and substantial technology investments remain vulnerable when failures occur within critical shared software and cloud ecosystems.
Downtime Costs by Business Size
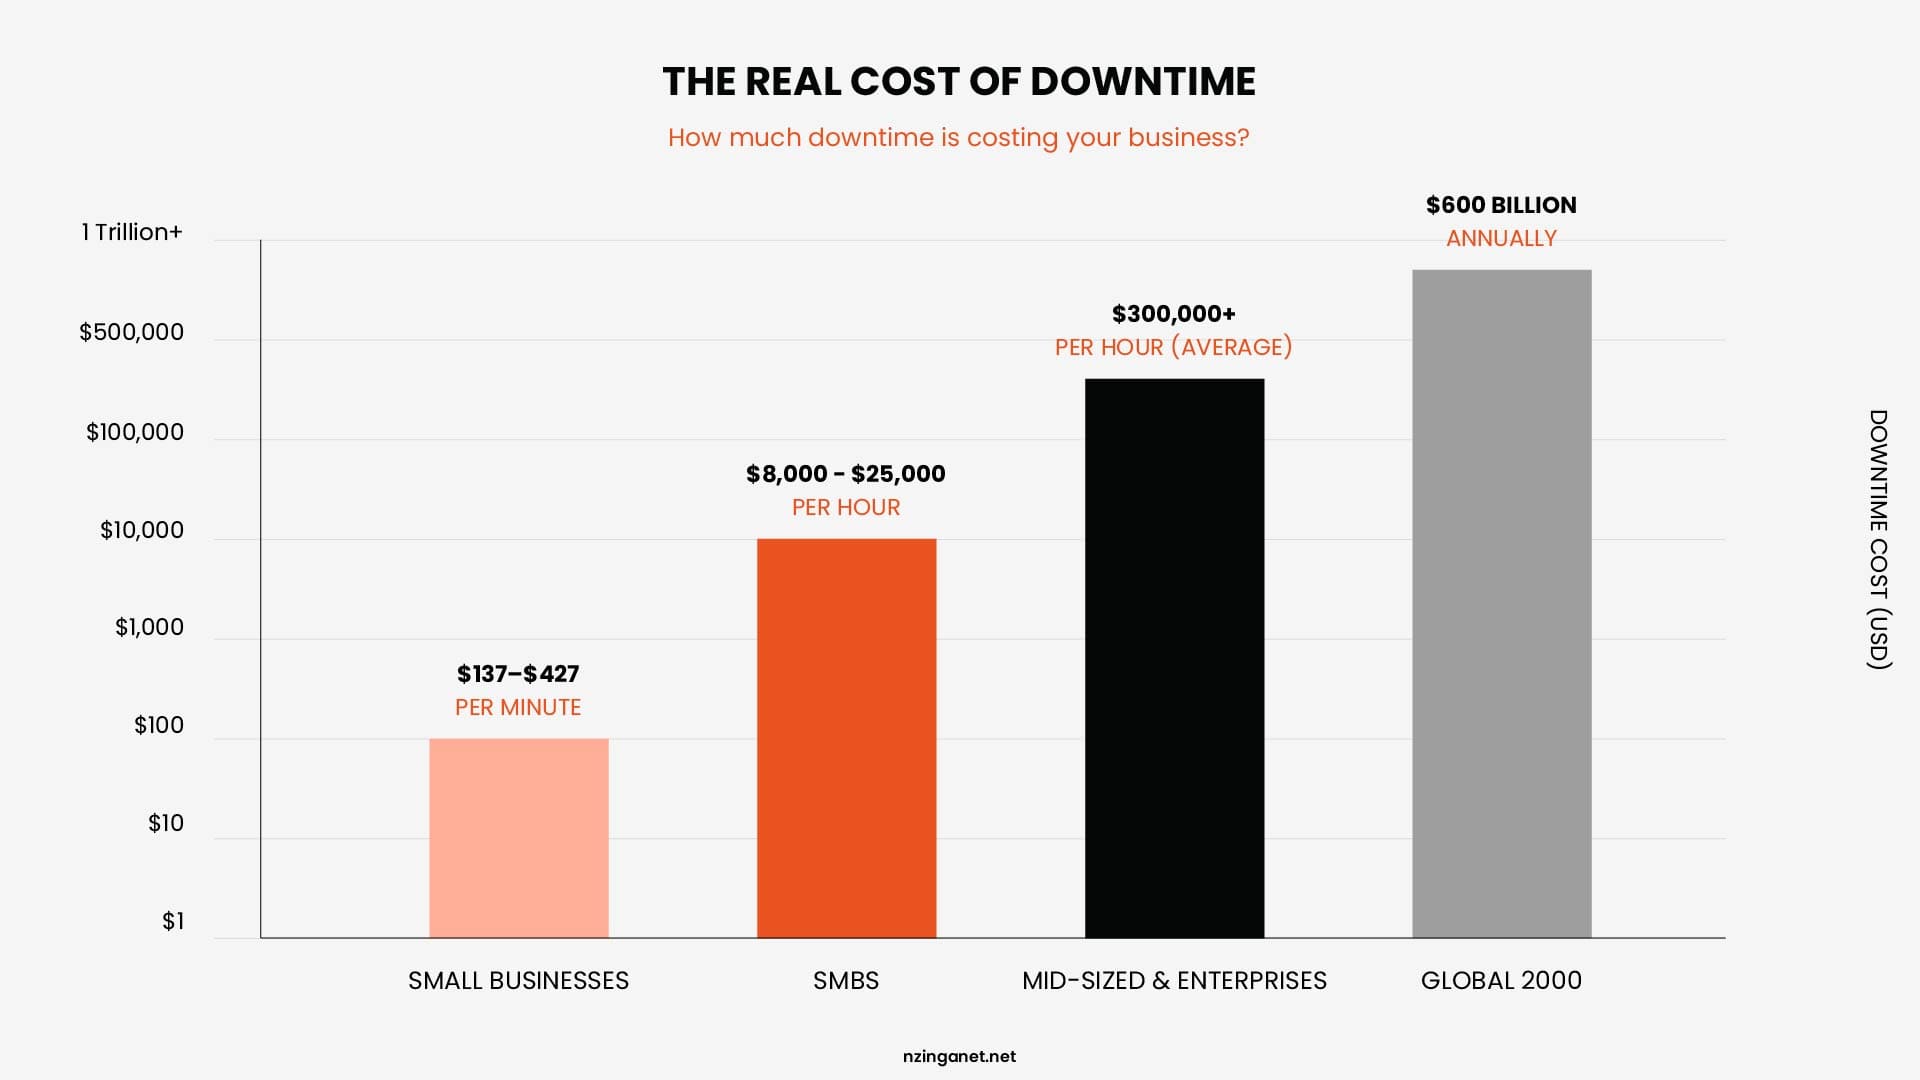
The financial impact scales dramatically with the size and complexity of an organization.
- Small businesses (typically under 50 employees or <$50M revenue) face downtime costs of approximately $137-$427 per minute, though some scenarios reach higher when factoring in lost productivity, operations, and sales.
- Small and mid-sized businesses (SMBs) typically incur losses between $8,000 and $25,000 per hour. For many SMBs, even a single afternoon of downtime can erase weeks of profit.
- Mid-sized and enterprise organizations experience much steeper costs. ITIC's 2024 Hourly Cost of Downtime Survey found that the average enterprise now loses more than $300,000 per hour, while over 40% of organizations reported hourly losses ranging from $1 million to $5 million during major outages.
- At the largest scale, Splunk's 2026 research estimates that companies in the Global 2000 lose an average of $15,000 per minute of downtime. Collectively, these organizations are estimated to lose approximately $600 billion annually, representing a 50% increase in downtime costs in just two years.
Downtime Costs by Industry
Industry plays an equally important role in determining the cost of downtime, which varies significantly by industry because some businesses depend on continuous access to systems, data, and digital services. A disruption that lasts minutes can affect revenue, customer trust, compliance requirements, and daily operations.
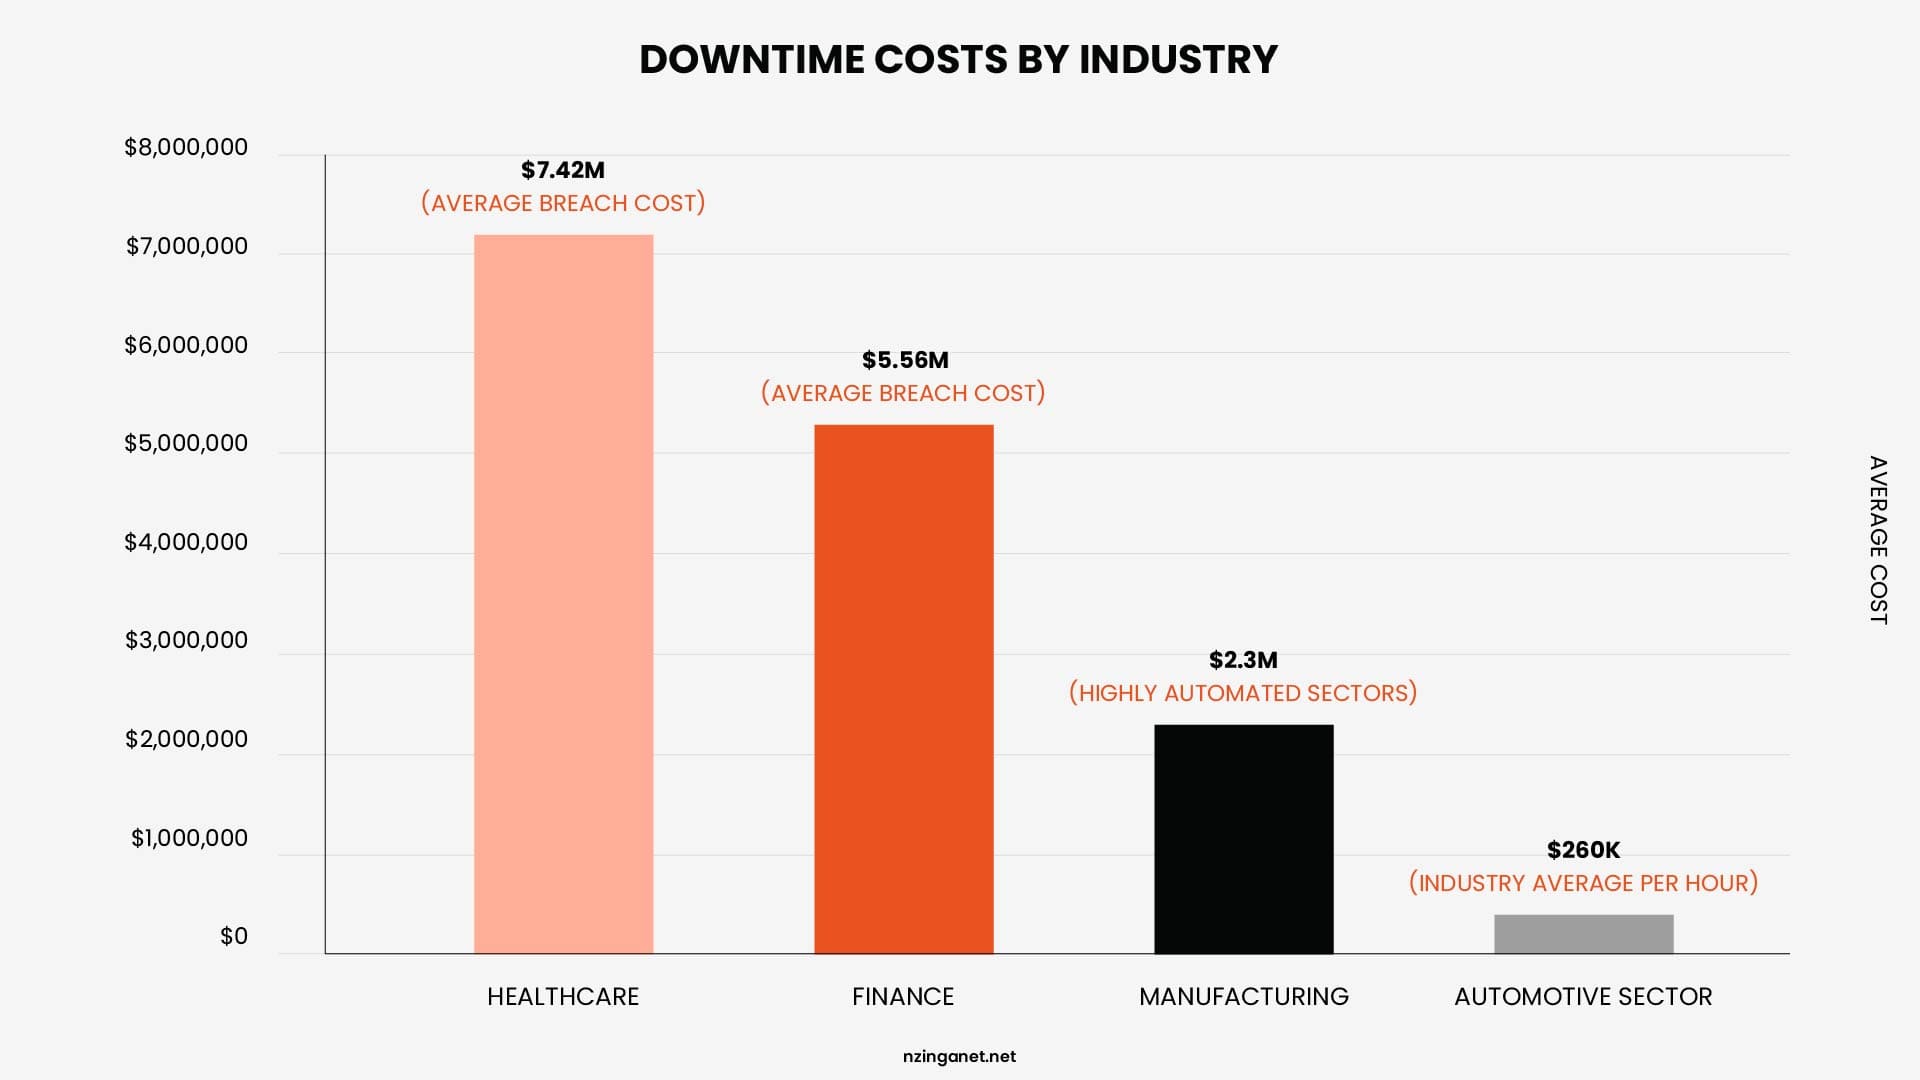
- Healthcare: $7.42M Average Breach Cost: Healthcare has reported the highest average data breach costs across industries for 14 consecutive years, according to IBM research. The $7.42 million average reflects several factors that make healthcare incidents especially costly, including strict HIPAA notification requirements, the high value of patient data, the need to restore critical clinical systems quickly, and the operational impact of taking electronic health record (EHR) systems offline during recovery.
- Finance: $5.56M Average Data Breach Cost: Financial services is one of the most regulated and frequently targeted industries. With an average data breach cost of $5.56 million, the sector ranks second only to healthcare. Financial institutions must meet strict reporting requirements across multiple regulatory bodies, including the SEC, FFIEC, state banking departments, and the Federal Reserve.
- Manufacturing: In manufacturing, downtime often stops production entirely. Industry averages place losses at around $260,000 per hour, while highly automated sectors such as automotive manufacturing can lose approximately $2.3 million per hour because assembly lines operate on tightly synchronized schedules where delays quickly cascade across suppliers and production facilities.
For organizations operating in highly regulated or continuously operating environments, every minute of downtime compounds financial losses while increasing operational and legal risk.
How To Calculate The Cost of Downtime
A basic way to estimate downtime cost is:
Downtime Cost = (Lost Revenue + Lost Productivity + Recovery Expenses + Business Impact) × Duration of Outage
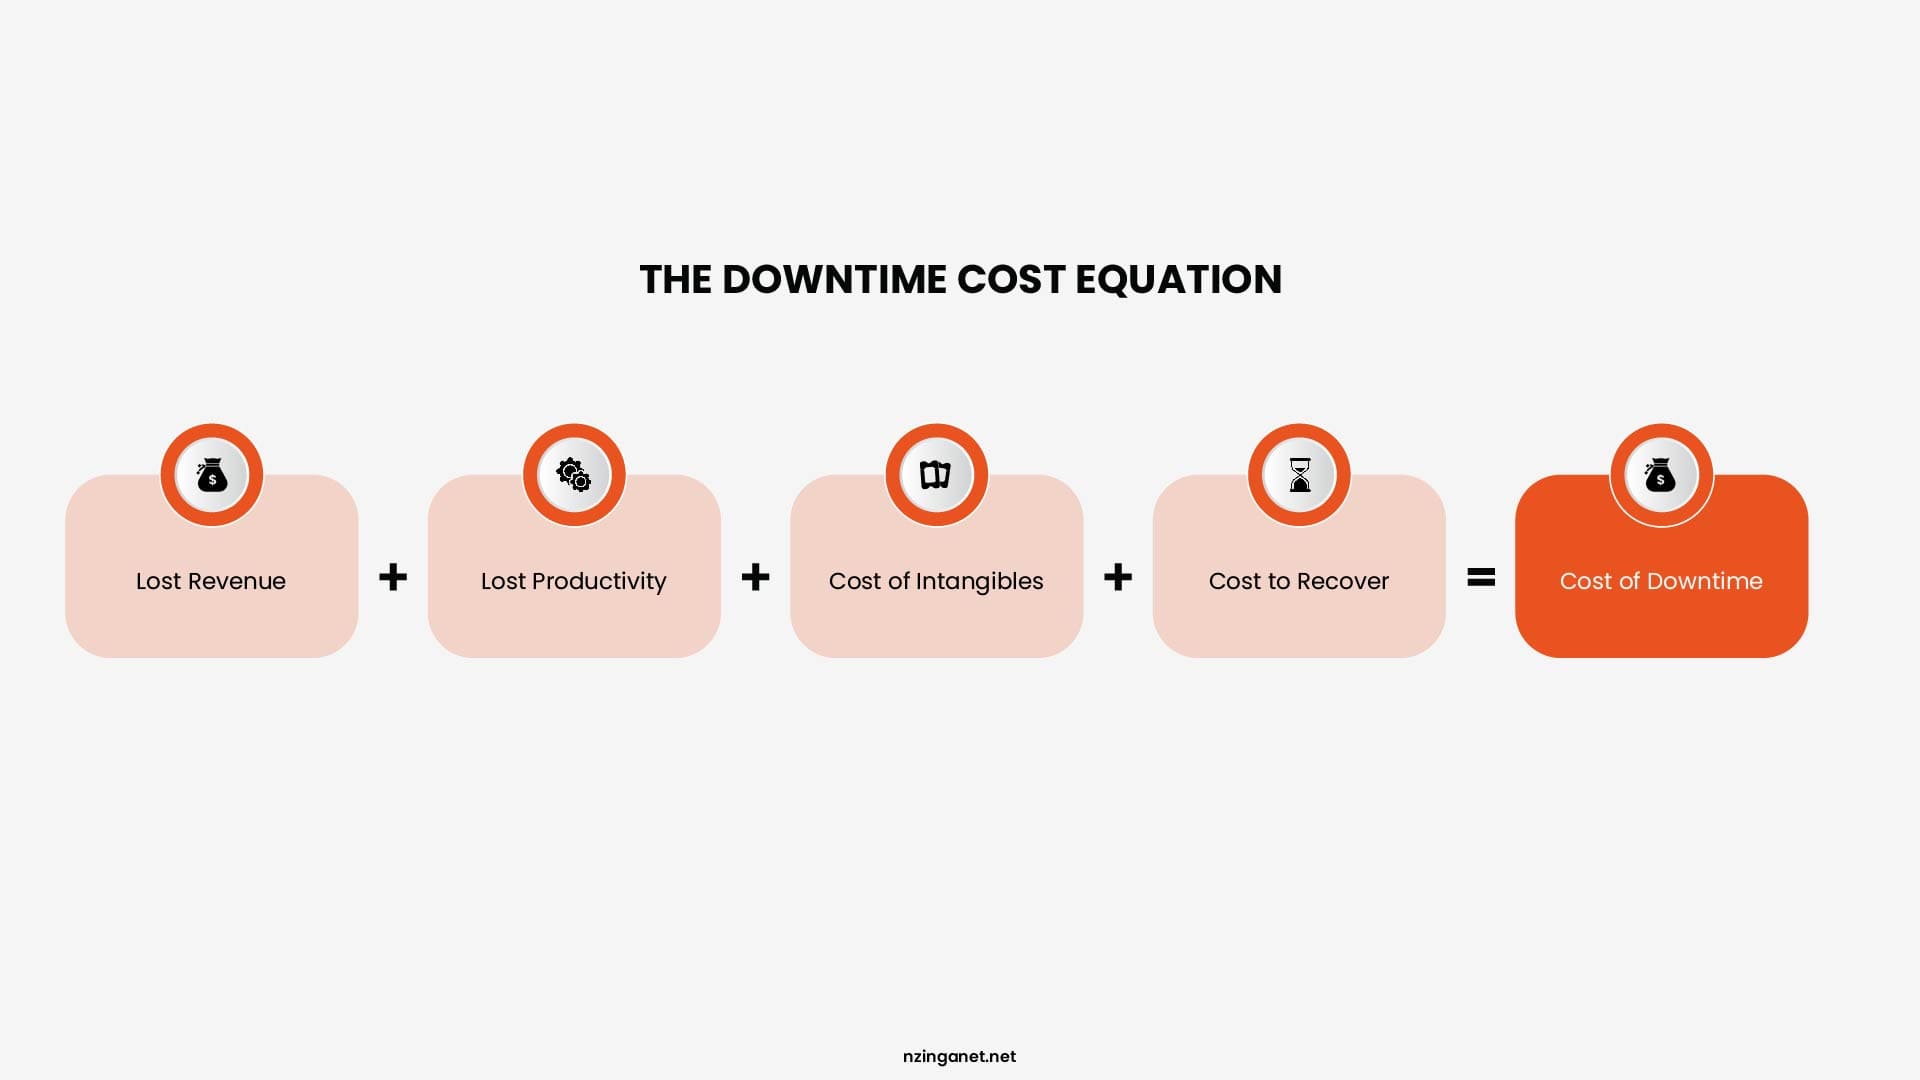
Each factor represents a different part of the financial impact:
- Lost Revenue: The income lost when customers cannot complete purchases, access services, or use critical business platforms during an outage.
- Lost Productivity: The cost of employees being unable to perform their work because the systems and tools they rely on are unavailable.
- Recovery Expenses: The additional costs involved in restoring operations, including emergency IT support, troubleshooting, repairs, overtime, and replacement resources.
- Business Impact: The longer-term effects of downtime, such as customer dissatisfaction, damaged reputation, missed opportunities, and potential loss of future revenue.
The actual cost varies based on the size of the business, industry, and dependence on technology. However, even a short outage can create significant financial consequences when it affects critical systems, customer-facing services, or daily operations.
How 24/7 IT Monitoring Actually Prevents Downtime
IT monitoring does not prevent every possible failure. Hardware can still break, software can still have bugs, and unexpected issues can still occur. What monitoring changes is how quickly your team becomes aware of a problem and how early they can take action.
A strong monitoring strategy helps businesses reduce downtime in several important ways:
- It reduces response time: One of the biggest goals in IT is lowering Mean Time to Recovery (MTTR), the average time it takes to restore a service after it fails. The faster you detect a problem, the faster you can fix it. A monitoring system that spots a failing hard drive, rising error rates, or unusual server activity gives your team hours, and sometimes even days, to act before customers notice anything is wrong.
- It catches problems while they're still small: Most outages start as minor issues. A server running low on memory or disk space is usually a simple fix if it's caught early. Ignore those warning signs, and that same server could crash in the middle of the night, leading to emergency calls, service disruption, and a much longer recovery.
- It shows what your customers actually see: Internal monitoring tells you whether your servers and applications are running. Synthetic monitoring goes a step further by checking your website or application from outside your network. That means it can detect problems your internal tools might miss, such as DNS failures, firewall changes, or connectivity issues that prevent customers from accessing your service.
- It reduces manual work: Without automated monitoring, someone has to keep checking dashboards, reviewing logs, or wait until a user reports a problem. Monitoring software handles those checks continuously and sends alerts to the right people as soon as something needs attention. Many modern platforms also learn what's normal for your environment, helping reduce unnecessary alerts during expected traffic spikes.
- It supports compliance and audits: Regulations and standards such as HIPAA, SOC 2, GDPR, and PCI DSS often require organizations to monitor critical systems and maintain records of incidents and uptime. Continuous monitoring creates those records automatically, making audits easier and providing a clear history of what happened and when.
Comparing IT Monitoring Tools
IT monitoring tools vary in their capabilities, deployment models, and pricing. Some focus on full-stack observability, while others specialize in network monitoring, infrastructure management, application performance, or uptime monitoring. The right solution depends on factors such as your IT environment, infrastructure size, monitoring requirements, and budget.
The table below compares some of the leading IT monitoring tools, highlighting their ideal use cases, pricing models, and key considerations:
| Tool | Best For | Pricing Model | Watch Out For |
|---|---|---|---|
| Datadog | Cloud-native environments requiring infrastructure, logs, APM, and security monitoring | Subscription-based, per host and feature | Costs increase as additional services are enabled |
| Zabbix | Organizations needing a free, highly customizable on-premises monitoring platform | Free, open source | Requires deployment, configuration, and ongoing administration |
| Nagios XI | IT teams that need extensive monitoring customization and plugin support | Perpetual license with optional maintenance | Interface and configuration are more manual than modern SaaS platforms |
| PRTG Network Monitor | Small to mid-sized businesses monitoring Windows-centric networks | Sensor-based licensing | Sensor usage can grow quickly, increasing licensing costs |
| Checkmk | Hybrid infrastructure monitoring with broad technology support | Free (Raw) or subscription (Enterprise) | Advanced configuration requires technical expertise |
| Dynatrace | Large enterprises seeking AI-powered observability and automated root cause analysis | Consumption-based subscription | Premium pricing may not suit smaller deployments |
| Prometheus + Grafana | Kubernetes, containers, and cloud-native workloads | Free, open source | Requires manual setup and additional tools for full-stack observability |
| UptimeRobot | Website, API, and service uptime monitoring | Freemium with paid monthly plans | Focuses on availability monitoring rather than deep infrastructure insights |
| SolarWinds Observability | Enterprises requiring unified infrastructure, network, and application monitoring | Subscription-based | Licensing costs vary depending on monitored resources and modules |
| ManageEngine OpManager | Mid-sized organizations managing networks, servers, and virtual infrastructure | Perpetual or subscription licensing | Advanced features may require additional ManageEngine products |
Building a Basic 24/7 IT Monitoring Strategy
A basic monitoring strategy should start with understanding the current IT environment, identifying critical systems, establishing performance benchmarks, and gradually expanding monitoring coverage. The following steps outline a practical process for building an effective 24/7 IT monitoring framework:
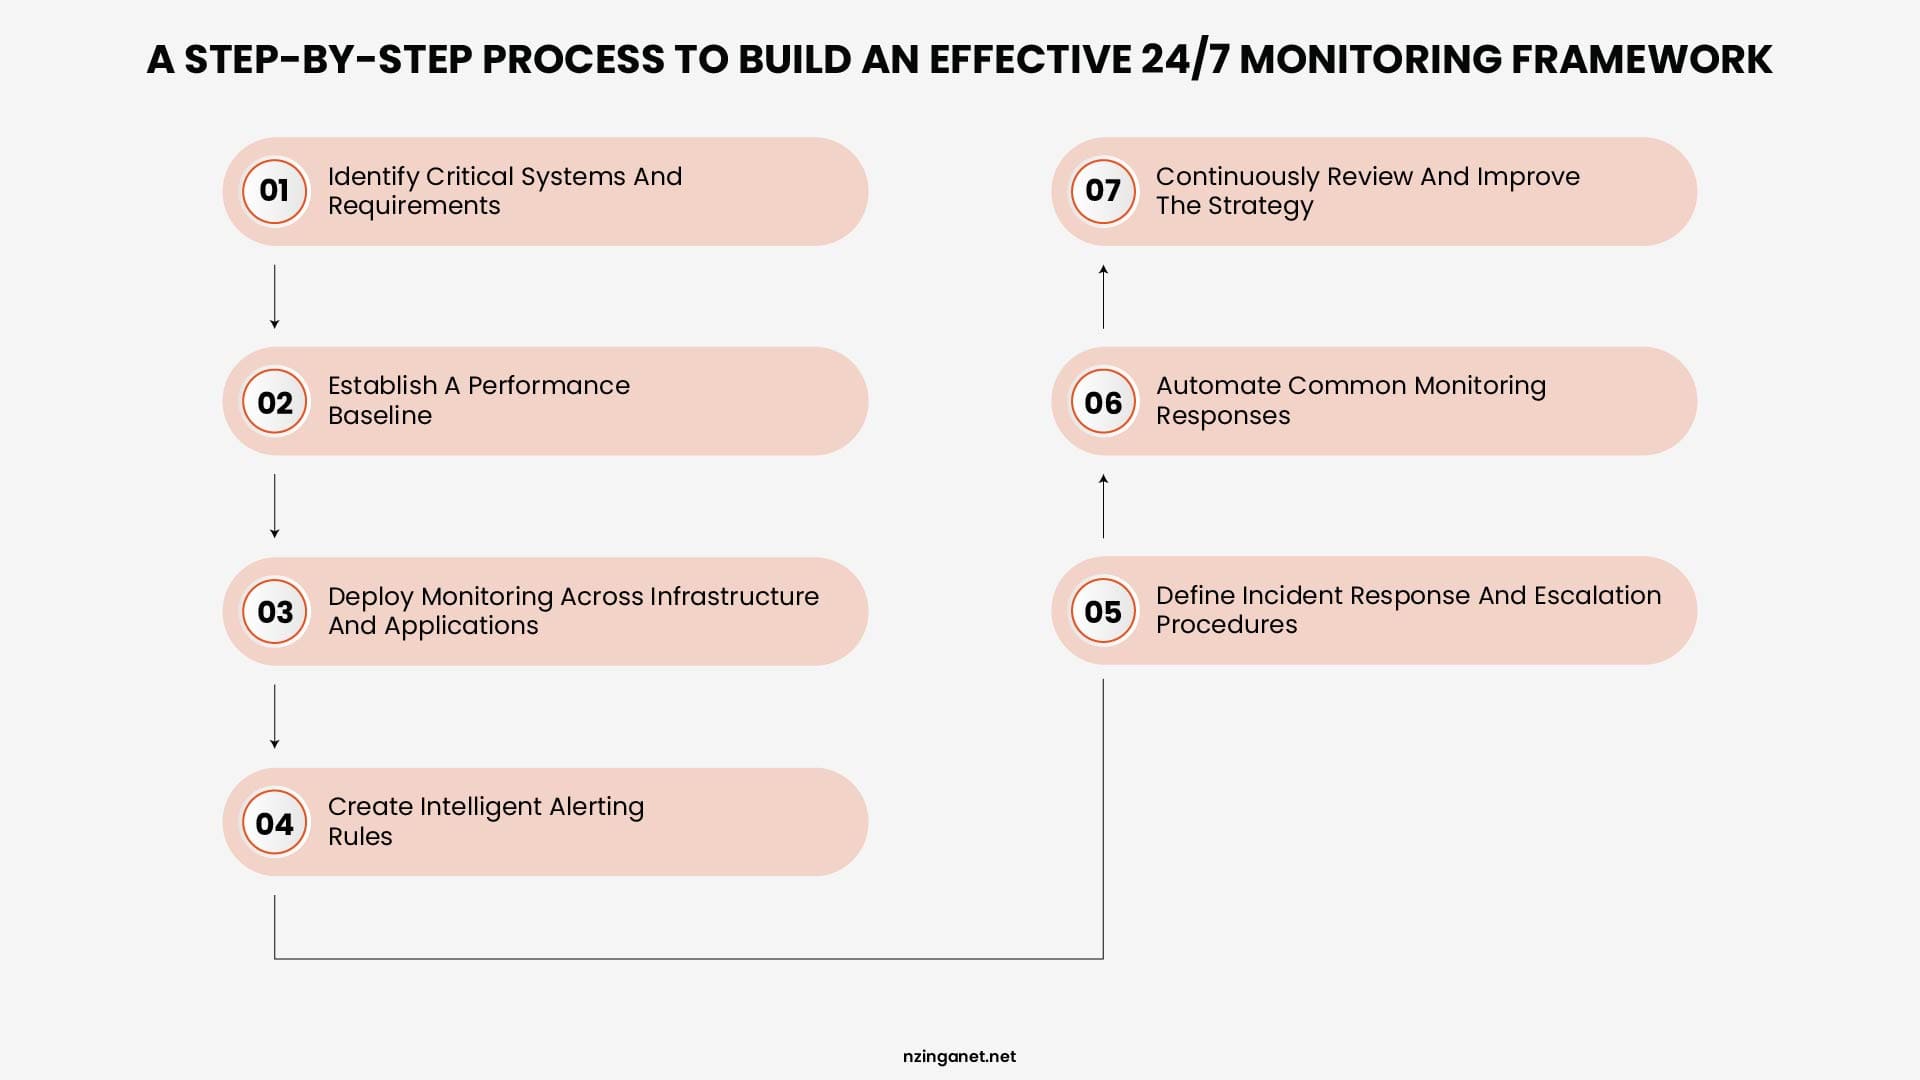
1. Identify Critical Systems and Monitoring Requirements
The first step in building a 24/7 monitoring strategy is understanding what needs to be monitored and why. Every organization has different priorities, so monitoring should focus on systems that directly affect business operations.
Start by identifying critical infrastructure components such as servers, databases, network devices, cloud services, applications, APIs, and customer-facing platforms. Each system should be classified based on its business importance, expected availability, and acceptable downtime.
For example, an e-commerce application or production database may require immediate alerts and continuous monitoring, while internal systems with lower business impact may only require periodic checks.
2. Establish a Performance Baseline
Before configuring alerts, organizations need to understand what normal performance looks like. A baseline provides a reference point for identifying abnormal behavior and prevents teams from reacting to every minor fluctuation.
Performance baselines typically include metrics such as CPU usage, memory consumption, storage capacity, network performance, application response times, database activity, and service availability.
For example, if a server normally operates at 50-60% CPU usage, a sudden increase to 95% may indicate a problem. Without historical data, it becomes difficult to determine whether a condition is normal or requires immediate attention.
3. Deploy Monitoring Across Infrastructure and Applications
Once critical systems and performance expectations are defined, the next step is implementing IT monitoring tools across the environment. The chosen platform should provide visibility into infrastructure, applications, networks, and cloud resources from a centralized location.
Modern IT environments often include a combination of on-premises servers, virtual machines, cloud platforms, containers, and SaaS applications. A monitoring solution should support these different technologies and collect relevant metrics, logs, and events.
A complete monitoring setup should provide insight into both system health and user experience. Monitoring only hardware resources is not enough because applications can experience performance problems even when servers appear healthy.
4. Create Intelligent Alerting Rules
Alert configuration is one of the most important parts of a 24/7 IT monitoring strategy. Poor alert management can create alert fatigue, where IT teams receive too many unnecessary notifications and important incidents are missed.
Effective alerting focuses on actionable events rather than every metric change. Alerts should be based on business impact, severity, and historical performance. For example, a temporary CPU spike may not require attention, but continuous high CPU usage combined with application slowdown should trigger an alert.
A good alerting system should include:
- Clear severity levels for different types of incidents
- Appropriate notification channels
- Escalation rules for unresolved issues
- Threshold adjustments based on real performance data
5. Define Incident Response and Escalation Procedures
Monitoring only detects problems; a response process determines how quickly those problems are resolved. Organizations should define clear procedures for handling different types of incidents.
A basic escalation workflow should identify who receives alerts, who owns the issue, and when the problem should be escalated to another team.
For example, a failed production server may immediately notify an on-call engineer, while a repeated performance warning may be reviewed during normal business hours. Documented response procedures reduce confusion, improve communication, and help teams resolve incidents consistently.
6. Automate Common Monitoring Responses
Automation improves response speed by handling repetitive tasks without manual intervention. Many common IT issues can be resolved automatically or partially automated through monitoring integrations and scripts.
Examples include restarting failed services, creating support tickets, clearing temporary storage, running health checks, or scaling cloud resources based on demand. Automation should be applied carefully, especially in production environments. Actions should be tested and controlled to avoid creating additional problems during incident response.
7. Continuously Review and Improve the IT Monitoring Strategy
A monitoring strategy should evolve with the IT environment. As organizations deploy new applications, migrate workloads to the cloud, or expand infrastructure, monitoring requirements will change.
Regular reviews help identify gaps in coverage, improve alert accuracy, and remove unnecessary monitoring rules.
Teams should analyze incident history, review uptime reports, and adjust monitoring policies based on operational experience. Continuous improvement ensures the monitoring system remains effective as technology and business requirements change.
IT Monitoring Checklist: What Every Business Should Monitor 24/7
Monitoring everything without a clear plan can create unnecessary alerts, while monitoring too little can leave critical systems exposed. Use this checklist to review whether your current monitoring approach gives your team the information and control needed to maintain reliable IT operations.
Visibility and Coverage Checklist
- ☐ Create an inventory of all business-critical technology assets
- ☐ Confirm every critical system has an assigned owner
- ☐ Identify which systems require immediate attention when issues occur
- ☐ Verify that monitoring covers both internal and customer-facing services
- ☐ Review whether cloud applications, SaaS platforms, and remote systems are included
- ☐ Remove unknown or unmanaged devices from your environment
Alert and Response Readiness Checklist
- ☐ Review current alerts and remove notifications that do not require action
- ☐ Define clear priorities for different types of incidents
- ☐ Confirm alerts reach the correct person or team
- ☐ Establish after-hours response procedures for critical issues
- ☐ Document what actions should be taken when an alert occurs
- ☐ Review past incidents to identify missed warnings or delayed responses
Performance Management Checklist
- ☐ Identify the normal operating range for important systems
- ☐ Track trends instead of only reacting to failures
- ☐ Review recurring performance issues before they become larger problems
- ☐ Identify systems approaching capacity limits
- ☐ Monitor changes that could affect reliability
- ☐ Compare current performance against business expectations
Security and Compliance Readiness Checklist
- ☐ Confirm important system activity is being recorded
- ☐ Review access activity for unusual behavior
- ☐ Verify monitoring data is retained according to business requirements
- ☐ Ensure security-related alerts have clear response procedures
- ☐ Regularly review monitoring reports for potential risks
- ☐ Maintain documentation needed for audits and compliance reviews
Operational Improvement Checklist
- ☐ Review monitoring reports on a regular schedule
- ☐ Identify repeated incidents and address their root causes
- ☐ Update monitoring as new applications or systems are added
- ☐ Test response procedures to confirm they work
- ☐ Adjust monitoring priorities as business needs change
- ☐ Measure improvements in response time and system reliability
Improve Your IT Reliability With Better Monitoring
IT problems become more expensive when businesses discover them too late. A strong monitoring process, as discussed, helps you identify issues early, understand what is happening, and take action before systems affect employees or customers.
Start by identifying the systems your business depends on, setting clear alerts, reviewing system performance, and creating a response plan for common issues. The right approach gives your team better visibility and helps reduce unexpected disruptions.
If you need help reviewing your current IT monitoring setup, NzingaNet can help you identify gaps and create a monitoring plan that fits your business. Schedule a consultation today to discuss how you can improve system visibility and reduce the risk of downtime.
Need Help with 24/7 IT Monitoring?
NzingaNet helps businesses design and implement IT monitoring strategies that reduce downtime, improve system reliability, and prevent costly outages. From assessment to implementation, our team can help you build a monitoring approach that fits your business needs.
COMMON QUESTIONS
Frequently Asked Questions
1. How do I know if my business needs IT monitoring?
Businesses should consider IT monitoring if they rely on technology for daily operations, customer service, communication, payments, or data management. If your team usually finds out about problems after employees report them or customers experience issues, your business likely needs better monitoring coverage.
2. What is the difference between IT monitoring and managed IT services?
IT monitoring focuses on tracking system performance, detecting issues, and sending alerts when something requires attention. Managed IT services typically include monitoring along with ongoing support, maintenance, troubleshooting, security management, and strategic IT guidance.
3. How long does it take to set up IT monitoring?
The setup time depends on the size and complexity of your IT environment. A small business with a limited number of systems may be monitored within a few days, while larger organizations with multiple locations, cloud platforms, and applications may require more planning and configuration.
4. Can IT monitoring work with cloud based systems and remote employees?
Yes. Modern IT monitoring solutions can monitor cloud services, remote devices, virtual environments, and applications used by distributed teams. This allows businesses to maintain visibility even when employees, systems, and data are spread across different locations.
5. What should I look for when choosing an IT monitoring provider?
When choosing an IT monitoring provider, look for experience with your type of technology environment, clear alert management processes, reliable support, transparent pricing, and the ability to customize monitoring based on your business needs. A good provider should help you focus on important issues instead of overwhelming your team with unnecessary alerts.
PENNSYLVANIA & BEYOND
Ready for 24/7 IT Monitoring That Actually Protects Your Business?
NzingaNet provides IT monitoring and managed IT services to small and mid-sized businesses across Pennsylvania and the surrounding region. From proactive system monitoring to full managed IT support, we give your business the visibility and reliability it needs.